

Resource Planner
In short
Resource Planner gives a live view of who is working on what, across every contract. Supervisors and technicians sit on a single roster showing availability, overlaps, coverage and utilisation. A built-in productivity dashboard turns that schedule into measurable workforce performance.
Most facility teams know how many technicians they have. Far fewer know, on any given morning, who is free.
Resource Planner is the roster that answers that. Everyone is scheduled in one place, and work from other modules appears on the same view rather than in a separate list.
Roster views
- Day, week, month and list views: with one-click navigation to today or any week.
- Weekly shift roster: Every resource grouped by role, showing daily availability, assigned tasks and total hours for the week.
- Live task visibility: Tasks appear on the roster with status, time, asset and reference number. Multi-day jobs are shown across the days they span.
- Smart filtering: Filter by contract, role, skill set or individual to find the right person quickly.
KPIs on the planner
Total resources, scheduled tasks, average utilisation, overlaps and staff on leave today.
The overlap count is the one that earns its place. A double booking spotted on the planner is a conversation. The same double booking spotted on the day is a missed job.
Productivity dashboard
One click from the planner opens live workforce KPIs for any contract, role and period, covering 7 days, 30 days, 90 days, year to date or a custom range.
| KPI | What it shows |
|---|---|
| Completion Rate | Share of tasks completed |
| On-Time Rate | Tasks completed within SLA |
| Overdue | Tasks past their due date |
| Rescheduled | Tasks moved at least once |
| Avg Utilisation | Workload against capacity |
| Avg Score | Average productivity score per resource |
Beyond the KPIs it compares planned against actual hours, with efficiency, overrun and labour cost. Charts show the task status mix, planned against actual hours, utilisation, and a productivity score for each resource.
It also flags when too few tasks have logged time, so a manager knows how reliable the figures are before acting on them. That is a detail worth noticing, because a utilisation figure built from a third of the jobs is not a utilisation figure.
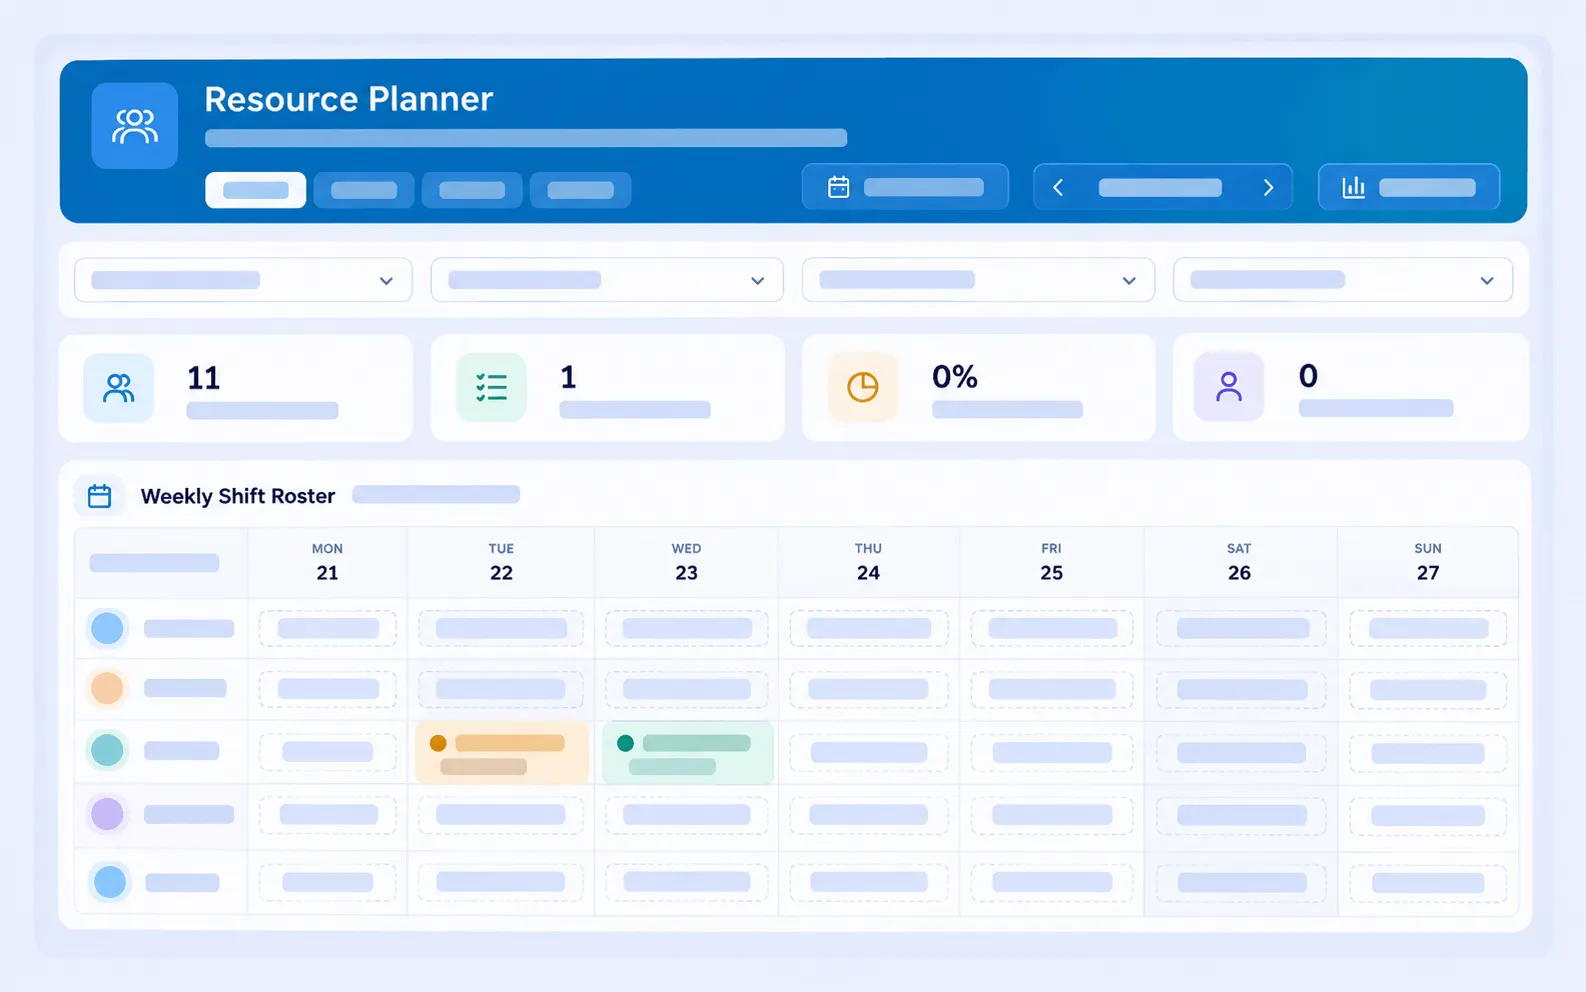
Planning technician and team workload across the week, so planned and reactive work can be balanced before it is assigned.
How it connects to other modules
- Task Management supplies the jobs that appear on the roster.
- Contract Management scopes the planner and the dashboard to a contract.
- SLA & KPI Management supplies the on-time measure.
Frequently asked questions
Does it show double bookings?
Yes. Overlaps are counted on the planner and flagged before they cause a missed job.
Can you filter by skill?
Yes. The roster filters by contract, role, skill set or individual resource.
What periods does the productivity dashboard cover?
7 days, 30 days, 90 days, year to date, or a custom range.
Does it compare planned against actual hours?
Yes, with efficiency, overrun and labour cost, plus a productivity score per resource.